
During the Western Flyer’s Pacific Northwest expedition, Oregon State University scientists worked with the captain and crew to deploy an autonomous underwater glider off the Washington coast.
Oregon State oceanographer and Western Flyer Foundation board member Jack Barth shares the story behind the deployment — and explains how these remarkable underwater vehicles are helping scientists better understand changing ocean conditions in the Pacific Northwest.
Launching an Underwater Glider
By Jack Barth, professor of oceanography Oregon State University; Western Flyer Foundation Board Member
May 24, 2026
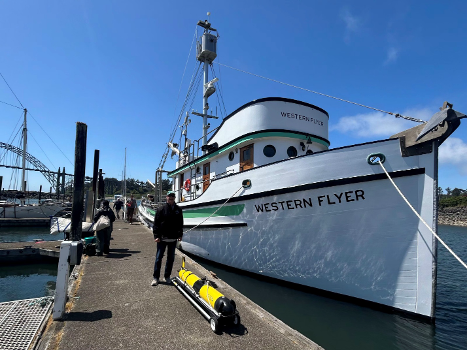
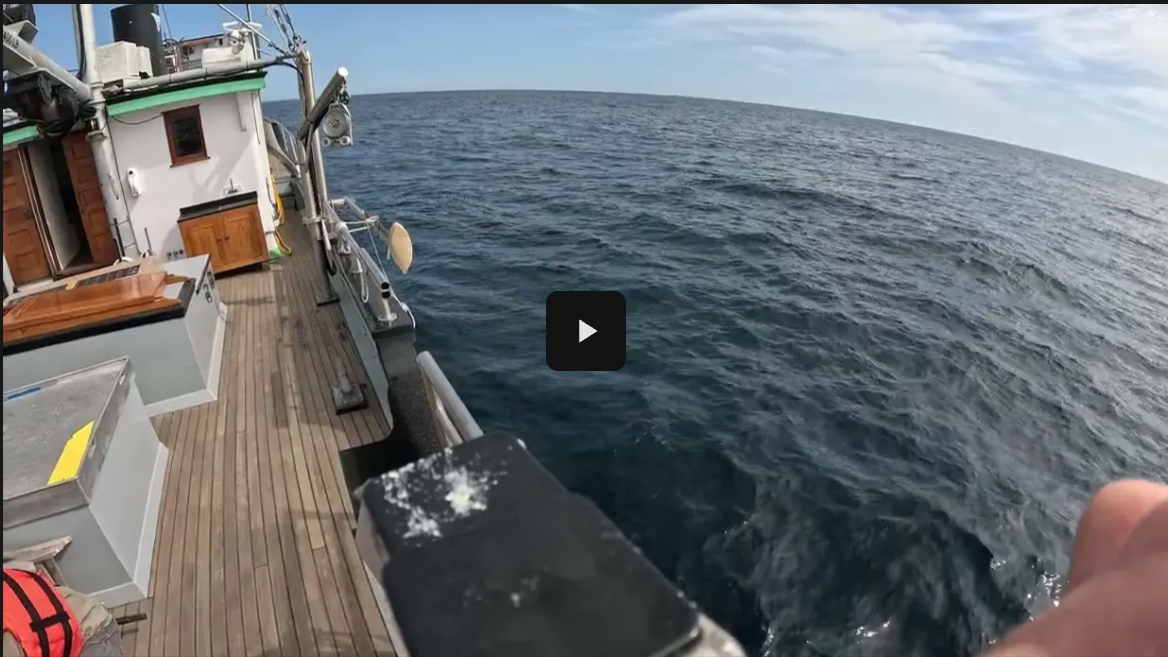
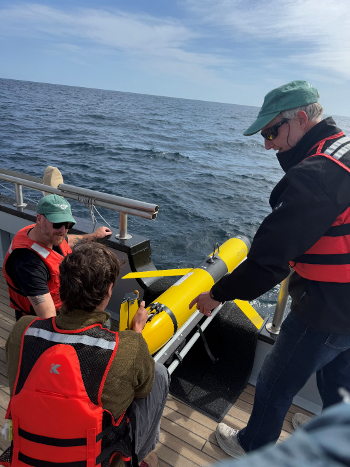
Today our team from Oregon State University worked with the Western Flyer captain and crew to launch an underwater glider. This is a form of an Autonomous Underwater Vehicle (AUV), that, once launched, operates completely on its own! There is no tether like the Remotely Operated Vehicle (ROV) used on the Western Flyer to do visual underwater surveys.
The goal of this work is to map the three-dimensional structure of the coastal ocean off the central Washington coast. This area is home to a wildly productive marine ecosystem including a wide variety of important fisheries (salmon, groundfish, halibut, crab). It also includes both the Usual and Accustomed fishing grounds of the Quinault Indian Nation and part of the Olympic Coast National Marine Sanctuary. There is much interest here in how ocean conditions affect the fisheries, in particular the appearance of low oxygen zones near the sea floor that can drive fish away and, in some extreme cases, lead to death of many marine animals.
How the Glider Works
These underwater gliders are marvels of modern engineering, boasting two powerful computers that control the flight of the glider and an array of onboard oceanographic sensors that collect data beneath the sea surface. The glider “flies” through the water without the aid of a propellor! They work by changing their buoyancy – how an object displaces water to allow it to float, like a ship or you in a swimming pool – to go up and down. We carefully balance the buoyancy and weight of the glider so it just floats in the known density of seawater. To dive, the glider makes itself slightly smaller thus displacing less seawater so that it is heavier than the surrounding seawater. Inside the glider a battery pack is driven forward in the nose so that the glider tips down and descends. The downward motion is turned into forward motion by two wings, and the vehicle gently glides toward the sea floor at about 15 centimeters per second. As it approaches the sea floor, it emits sound waves to detect the bottom and turns around at a preprogrammed distance from the bottom, usually 3-5 meters off the bottom. To go back up, it expands its size, displaces more seawater so it becomes lighter than the surrounding seawater, pulls the battery pack backward and goes up, gliding forward. The glider can go about 15 kilometers a day. They are not fast like a propellor-driven AUVs – these burn energy quickly to go fast and often only last a half to two days – but can stay out from 1-6 months at a time. The gliders are powered by rechargeable lithium batteries. They run 24/7/365 and go up and down with the waves, operating in any kind of weather and sea state, and they don’t get seasick!
We control the glider via satellite cell phone. We pay about 84 cents a minute to connect to them while they are at the sea surface via the Iridium satellite cell phone network. This allows us to fly gliders anywhere in the world. On a preprogrammed interval, usually 1-6 hours, the glider surfaces by inflating an air bag in the rear of the glider to raise the antennae up above the sea surface. The glider then “phones home” and reports its position and battery status, transmits a subset of data, and awaits new commands. Our glider operators, including highly skilled marine technicians – on the Western Flyer today are Brian VerWey and Jace Marquardt — as well as students, fly the glider on various sampling missions. These missions are pre-programmed and, for example off the Washington coast, are a set of zig-zag lines across the continental shelf and slope from about 30 meters water depth to 30 miles offshore in 500 meters of water.
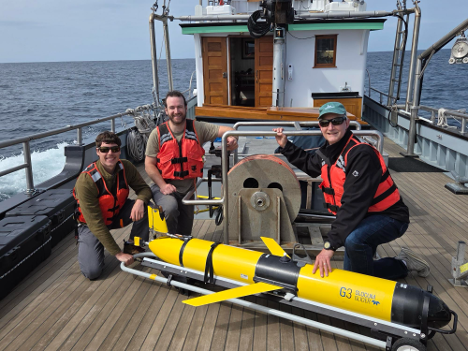
Underwater gliders have been around for about 25 years and have advanced greatly. They were envisioned in the late 1980s, but weren’t realized until several technological advances came together. These include readily available high-powered computers on 4-inch boards (to fit in the small glider spaces), miniaturized memory (courtesy of the electronics industry and the 128-256 gigabytes storage on each of our cell phones), a satellite-based global cellphone network, and rechargeable lithium batteries. Even better battery technology is needed and advances from the electric vehicle and battery storage industries are eagerly awaited.
The underwater glider carries exactly the same basic oceanographic instruments that we use in the flow-through system and the vertical profiling CTD on the Western Flyer: temperature, salinity and depth (pressure). To this basic set, the glider also measures dissolved oxygen, turbidity, chlorophyll fluorescence (a measure of phytoplankton in the water), and Colored Dissolved Organic Matter (CDOM) a good tracer of river water rich with brown, decayed organic matter. In an ingenious yet time-honored way, we can also get the depth-averaged (the average of the current from the sea surface to the sea floor) velocity across the glider track. This is because the glider is pushed sideways by the ocean currents and we can use the difference in the location it actually surfaces compared with the prediction of where it should surface based on the vehicles speed and pitch angle, to estimate the depth-averaged current. This technique is called “dead reckoning” and has been used by sailors over time to estimate predicted location based on boat speed, heading (or direction or course), and elapsed time. In fact, Benjamin Franklin made the first map of the Gulf Stream in the western North Atlantic by using the dead reckoning estimates and actual ship positions – the difference being caused by ocean currents – from the sailing vessels delivering mail to and from England while he was postmaster general of the United States. Aside: Benjamin Franklin is on my list of people I’d love to go to dinner with!
Mapping Ocean Conditions
Underwater gliders are particularly well-suited for monitoring conditions beneath the sea surface. While satellites can measure sea-surface temperature and ocean color, from which a measure of chlorophyll in plankton can be derived, they cannot see more than a few meters below the sea surface. The gliders can descend to within a few meters of the seafloor, making measurements throughout the water column. We are using them to make maps of dissolved oxygen levels near the sea floor, the region where many commercially important species live like Dungeness crab, rockfish and flatfish like halibut. The process of wind-driven upwelling that happens each summer when winds blow out of the north and, under the influence of the Coriolis force, push surface waters offshore that are, in turn, replaced by deep, cold, salty and nutrient-rich water, also brings low oxygen waters toward shore along the ocean bottom. These waters are low in oxygen but not hypoxic, a level of oxygen that harms many marine organisms. The oxygen levels in the near-bottom water are driven lower by the decay of organic matter, including from dying phytoplankton. This is a natural cycle, but recently the levels of oxygen have become lower, more widespread and longer lasting. In recent studies*, nearly half of the near-bottom coastal ocean off Oregon and Washington was hypoxic during the summer season. For comparison, this area is as big as the Willamette Valley in Oregon, or the Seattle metropolitan area, or the state of Connecticut, or half the size of Belgium. While the causes of this recent widespread and increasing hypoxia are still under investigation, climate change influences leading to lower subsurface oxygen levels beneath a warmed surface ocean and stronger and more persistent upwelling-favorable winds near the coast are leading culprits.
Why This Research Matters
The underwater gliders have revolutionized our underwater view of the ocean. They operate year-round and at a fraction of the cost of oceanographic research vessels. While they cost about $200,000 – $400,000 each depending on the number of sensors and mission duration, it only takes a few weeks to several months to make up their cost based on typical daily ship time costs if ships were used to make the same measurements. Now gliders can’t measure everything and we definitely still need ships to do plankton and fish tows, conduct biological and chemical experiments, install oceanographic moorings, run human-occupied underwater vehicles, among a myriad of other ocean science investigations. But gliders can measure a lot, can be out all the time, and when coupled with shipboard studies are contributing enormously to our understanding of the ocean! Stay tuned for maps of ocean conditions from this latest deployment (https://nvs.nanoos.org/AutonomousVehicles choose “WA Shelf Glider”).
The research is sponsored by the Northwest Association of Networked Ocean Observing Systems (NANOOS – https://nanoos.org), the Oregon-Washington regional association of the National Oceanic & Atmospheric Administration’s Integrated Ocean Observing System. That’s NOAA’s IOOS NANOOS – got it 🙂 Oregon State University flies the gliders in collaboration with both the Columbia River Inter-Tribal Fish Commission and the Quinault Indian Nation. Once a year, we take the underwater gliders to the Quinault Indian Nation school in Taholah to engage students there in ocean science and the science and engineering that go into the underwater gliders. We want to “stir curiosity” in the next generation!
* Barth, J. A., S. D. Pierce, B. Carter, A. Y. Erofeev, J. L. Fisher, R. A. Feely, K. C. Jacobson, A. A. Keller, C. A. Morgan, J. E. Pohl, L. K. Rasmuson, and V. Simon, 2024. Widespread and increasing near-bottom hypoxia in the coastal ocean off the United States Pacific Northwest. Nature Scientific Reports, 14, 3798, https://doi.org/10.1038/s41598-024-54476-0.
Barth, J. A. and S. Coleman, 2025. Spatial variability in year-to-year, near-bottom hypoxia over the United States Pacific Northwest continental shelf. Journal of Geophysical Research – Oceans, 131, e2025JC023821, https://doi.org/10.1029/2025JC023821.
Posted in Blog, Research